
Ecological Footprint
Ecological Footprint Accounting measures the demand (Ecological Footprint) on and supply (biocapacity) of a set of nature's ecological services (renewable resource generation and waste assimilation). Both Ecological Footprint and biocapacity are expressed in global hectares (gha) - a standard unit which represents the productivity of a world-average, biologically-productive hectare. This allows for direct comparison of the two metrics to determine the ecological balance between the supply and demand of natural resources. To live within the means of our planet's resources, humanity's global Ecological Footprint should be equal to or less than the available biocapacity on our planet. However, to give space for biodiversity to thrive, humanity's Ecological Footprint should be much less than the planet's biocapacity (Wilson 2016).
Ecological Footprint (pressure on local biocapacity) represents the fraction of local regeneration (biocapacity) that is demanded through local harvest (and waste production). It is calculated as the Ecological Footprint of production (EFp) divided by biocapacity. Values less than 1 indicate that harvest and waste production are less than local regeneration/assimilation. Values greater than 1 indicate that harvest and waste production exceed local regeneration/assimilation.
Trends in global Ecological Footprint and biocapacity tell us that the human economy requires more biocapacity each year, indicating unsustainable rates of global consumption. At the country level, many countries show trends of Ecological Footprint increasing faster than biocapacity (Figure 1). Running a biocapacity deficit (demanding more biocapacity than is available within the borders of that country) is a risk in a resource constrained world.
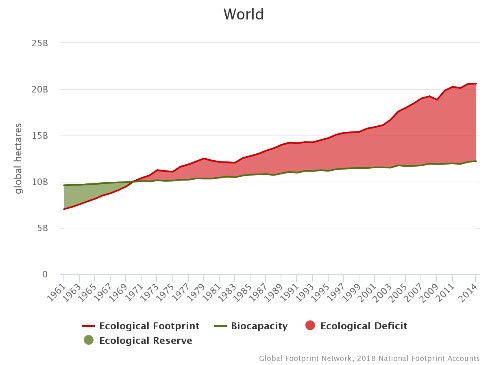
Figure 1. Timeseries of the Ecological Footprint and biocapacity of the world from 1961-2014, showing the transition from being in Ecological Reserve (shaded green) to Ecological Deficit (shaded red) (Global Footprint Network, 2018).
The world's ecological deficit is referred to as global ecological overshoot. Since the 1970s, humanity has been in ecological overshoot, with annual demand on resources exceeding what Earth can regenerate each year. In 2018, humanity was using the equivalent of 1.7 Earths to provide the resources we use and absorb our waste (note that the current Ecological Footprint methodology tracks only one form of waste: CO2 emissions (Borucke et al., 2013)). This means it takes roughly seven months for humanity to use what the Earth regenerates in a year. Humanity is contributing to biodiversity loss by using more ecological resources and services than nature can regenerate through overfishing, overharvesting forests, and emitting more carbon dioxide into the atmosphere than forests can sequester.
Ecological Footprint analysis examines the size of society's metabolism with a specific research question: how much of the regenerative capacity of the biosphere is being used by human activities? To answer this question, Footprint analysis measures how much biologically productive land and water area an individual, city, country, region, or humanity uses to produce the resources it consumes and to absorb the waste it generates.
Consumption vs Production
The term "Ecological Footprint" commonly refers to the Ecological Footprint of Consumption (EFC), unless otherwise specified. For a country, the Ecological Footprint of consumption is calculated by summing the Footprint of all primary production/harvest activities within the borders of that country (the Ecological Footprint of Production (EFP)), then adjusting for the Ecological Footprint embedded in trade by subtracting the Ecological Footprint of Exports (EFE) and adding the Ecological Footprint of Imports (EFI). Thus, strictly speaking, it is the Footprint of apparent consumption. Per-capita EFC is equal to a country's total EFC divided by its population.
Total vs Per Capita
Both Ecological Footprint and biocapacity can be represented using total and per capita values. Total refers to the total EF for a given population and can be compared to total biocapacity; per capita represents the total Ecological Footprint or total biocapacity of a region divided by the population of the region. When comparing between countries, population size, societal resource efficiency, and lifestyle are strong factors affecting total EF. Comparing the per capita EF across countries provides a better indication of relative societal resource efficiency and lifestyle. If a country's Ecological Footprint per capita is higher than biocapacity per capita, its inhabitants are demanding more resources and producing more waste than their country can regenerate and absorb, respectively.
Relation to biodiversity
A country's Ecological Footprint of Consumption represents the aggregate pressure that the population's consumption exerts on ecosystems, and by extension, biodiversity; however, it does not specify where that pressure is located. To understand how local consumption of resources (EFC) in a single country affects global biodiversity, a detailed analysis of trading partners in the supply chain is necessary. For a single country, the EFP can be compared to biocapacity to understand how much pressure is placed on ecosystems within that country.
Biocapacity, the ''supply'' side of Ecological Footprint accounting, refers to the capacity of Earth's biologically productive surfaces to provide renewable resource-provisioning and climate-regulation ecosystem services. At its core, biocapacity reflects the actual ability of autotrophic organisms to capture energy from the sun via photosynthesis, and use this energy to concentrate and structure matter into resources, the latter defined as any form of biomass that humans find useful. Biodiversity is a critical factor for the productivity of ecosystems, and ecosystems with poor biodiversity may display fluctuations in biocapacity trends (because of poor resilience/robustness of low diversity ecosystems) or decreasing trends in biocapacity as a result of decreased ecosystem function.
The Ecological Footprint was developed by Mathis Wackernagel and William Rees in the early 1990s as a practical way to measure the amount of nature appropriated by humanity. Since then, thousands of scientific studies and over 10 national government reviews have been published, contributing to a wealth of verification, interpretation, application and improvement research.
This indicator estimates global ecological overshoot by making conservative assumptions of Ecological Footprint. Anthropogenic demands are limited to those demands on bioproductivity, and do not include freshwater consumption, soil erosion, or greenhouse gas emissions besides CO2. The methodology behind the Ecological Footprint is continually being improved and updated (for example, see Mancini et al. 2016).
Galli et al. (2016) outlines some strengths and weaknesses of the Ecological Footprint and provides different viewpoints regarding the Ecological Footprint approach, methodology, accuracy, flow measurements, scales and resolutions, role of food security, application for society, and political relevance. It also provides a detailed table comparing the Ecological Footprint to other calculations and international indicators.
To alleviate some issues from input data, a conservative data cleaning algorithm was used on some trade datasets to identify and remove extreme outliers (Borucke et al. 2013). Ultimately, the quality and reliability of the Ecological Footprint depends on the accuracy, availability, and completeness of the input datasets. Therefore, each country dataset is given a quality score (https://www.footprintnetwork.org/data-quality-scores/).
More information and further resources are available in the indicator factsheet here.