
Global Biodiversity Engagement Indicator
The Global Biodiversity Engagement Indicator spatially represents the public's understanding, awareness, and appreciation of biodiversity in 2018. This indicator integrates data on public awareness of biodiversity-related topics from Twitter, online newspapers, and Google Trends.
Higher values indicate a higher amount of public awareness and engagement around biodiversity-related topics.
The trend line displays the monthly trends across the "Overall Indicator" for the time period containing data.
The Global Biodiversity Engagement Indicator was developed by tracking the usage of 22 keywords relating to biodiversity in 31 languages across Twitter, online newspapers, and Google Trends (a metric reflecting the popularity of top search queries in Google Search) (Cooper et al. 2019). The keyword scores for Twitter and online newspapers were then scaled to use a similar methodology to Google Trends so they could be directly comparable (Proulx et al. 2014; Le Nghiem et al. 2016). Once the indicator scores were scaled, a final score was calculated for each country and time period by calculating the mean values across all biodiversity-related keywords. To calculate the overall indicator integrating all 3 platforms, a mean value was calculated across Twitter, online newspapers, and Google Trends (Figure 1). The 2018 data reflect input from November 2017 through October 2018.
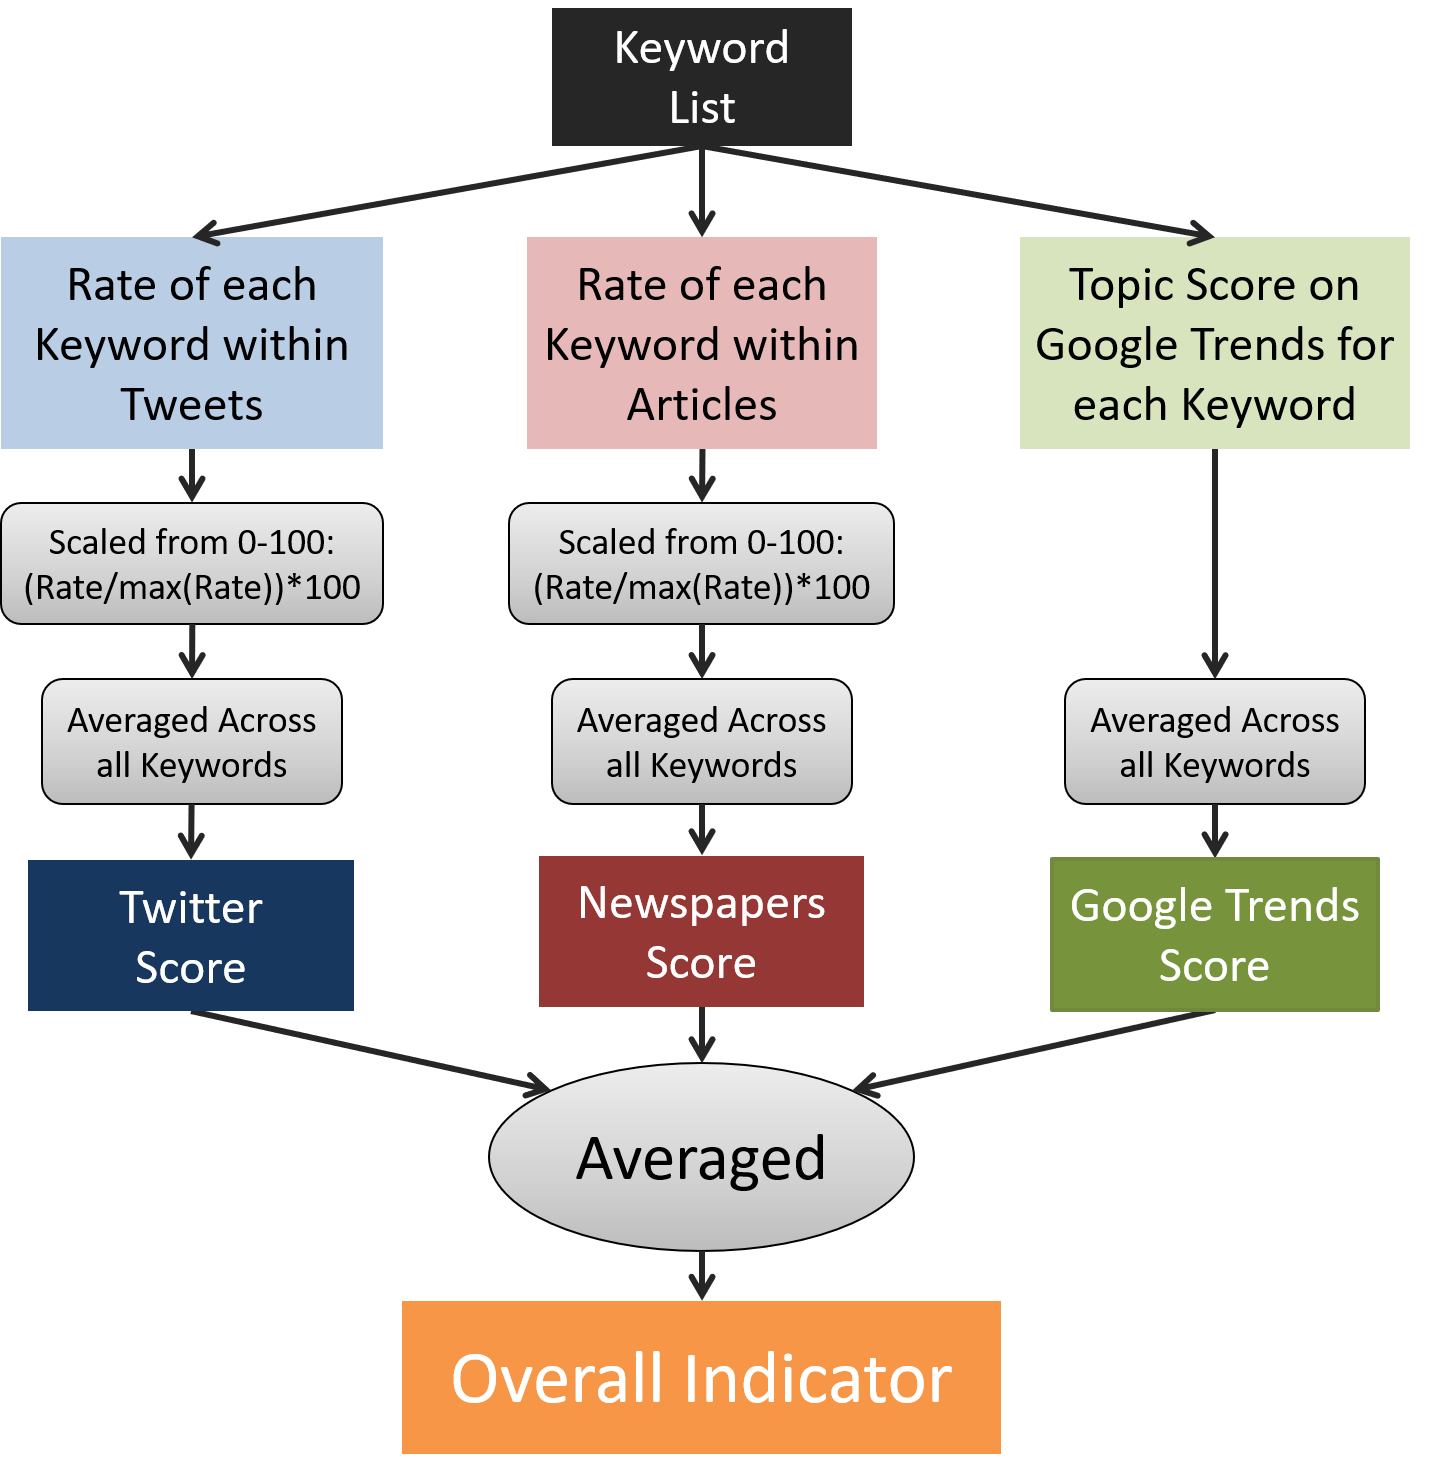
Figure 1. Flow chart of the methodology used to calculate the indicator (reprinted from Cooper et al. 2019).
The Global Biodiversity Engagement Indicator currently only includes data for one full year. Indicator values may change throughout the year due to seasonal trends or event-related spikes (Cooper et al. 2019). Because multiple years of data are needed to display a meaningful change rate per country, the "Most Recent" country values are the only spatial representation for this indicator. The "Most Recent" values are an average across all months from the "Overall Indicator" values.
There are limitations surrounding the complex issue of integrating data across multiple languages. The 23 keywords tracked in this indicator were originally selected from an English-language glossary, meaning that there may be non-English keywords important to biodiversity that are not captured. This methodology may have also missed synonyms and homonyms across different languages, as well as imperfect translations (Roll et al. 2017; Correia, 2018; Correia et al. 2018), possibly leading to biased results.
Although social media provides an inexpensive way to gain information on global public engagement at high temporal resolution, there are several caveats that should be considered. Social media data may have biased population samples, users may exaggerate their behavior compared to reality, and spammers may be posing as humans (Hargittai and Hinnant, 2008; Ruths and Pfeffer, 2014; Tufekci, 2014).
Another limitation is this indicator cannot differentiate biodiversity-related topics between promotional information posted by conservation NGOs and other members of the public that are not professional conservationists.
More information and further resources are available in the indicator factsheet here.
The raw data can be downloaded and analyzed further at the Global Biodiversity Engagement Indicator website.
Cooper, M. W., Di Minin, E., Hausmann, A., Qin S., Schwartz, A.J., Correi, R.A., 2019. Developing a global indicator for Aichi Target 1 by merging online data sources to measure biodiversity awareness and engagement. Biological Conservation. 230, 29-36
Correia, R.A., 2018. Google trends data need validation: comment on Durmusoglu (2017).
Hum. Ecol. Risk. Assess. 1-4.
Correia, R.A., Jaric, I., Jepson, P., Malhado, A.C.M., Alves, J.A., Ladle, R.J., 2018. Nomenclature instability in species culturomic assessments: why synonyms matter. Ecol. Indic. 90, 74-78.
Google Trends (2018). Retrieved October 2017 - October 2018 from https://trends.google.com/trends/?geo=US
Hargittai, E., Hinnant, A., 2008. Digital inequality: differences in young adults' use of the
Internet. Commun. Res. 35, 602-621.
Le Nghiem, T.P., Papworth, S.K., Lim, F.K.S., Carrasco, L.R., 2016. Analysis of the capacity of google trends to measure interest in conservation topics and the role of online news. PLoS One 11.
Proulx, R., Massicotte, P., Pépino, M., 2014. Googling trends in conservation biology. Conserv. Biol. 28, 44-51.
Roll, U., Correia, R.A., Berger-Tal, O., 2017. Using machine learning to disentangle homonyms in large text corpora. Conserv. Biol. 32 (3), 716-724.
Ruths, D., Pfeffer, J., 2014. Social media for large studies of behavior. Science 346, 1063-1064.
Tufekci, Z., 2014. Big questions for social media big data. In: 8th Int. Conf. Weblogs Soc. Media, ICWSM, pp. 505-514.
Twitter (2018). Retrieved October 2017 - October 2018 from https://developer.twitter.com/
Webhose (2018). Retrieved October 2017 - October 2018 from https://webhose.io/